Goals & FIRE and the Long-term view
As of 1 November 2026 · Edited by foliologic.
foliologic. has two new features for long-term investors, live since 1 November. On the Goals & FIRE page you decide what you are working towards: an amount by a date, or financial independence, with its target amount worked out from your spending. The Long-term view shows that goal right on your overview.
Both are included in every plan, Free too.
Your goal: an amount and a date
You enter a target amount, a target date, your monthly savings rate and an assumed return. From these, foliologic. estimates the month in which your portfolio reaches the amount and sets it against your date, for example "Your date December 2032 · estimated September 2030". Under "Assumptions and scenarios" in the "Your goal" section of the Long-term view, the estimate is also shown for returns of 3, 5 and 7% – so you can see how much it depends on your assumption.
What counts is your portfolio value across all your accounts: the market value of your holdings plus your bank deposits, such as an instant-access savings account. The return you assume is after costs and before tax. The calculation applies the same return to every year: it models neither market swings nor losses, and for an amount of your own it leaves out inflation – except for a savings rate you set to rise with it. Each estimate is therefore a calculation from your assumptions, not a forecast.
Milestones along the way
foliologic. divides the way to your goal into milestones of round amounts – every €20,000 for a €100,000 goal, for example. When your portfolio passes a milestone, the milestone gets a date – provided a value below it was recorded for an earlier month. A milestone already reached when the plan started stays without a date. For the milestones ahead, foliologic. shows the estimate from the plan's start next to today's, so you can see whether you are moving faster or slower than you assumed when the plan started.
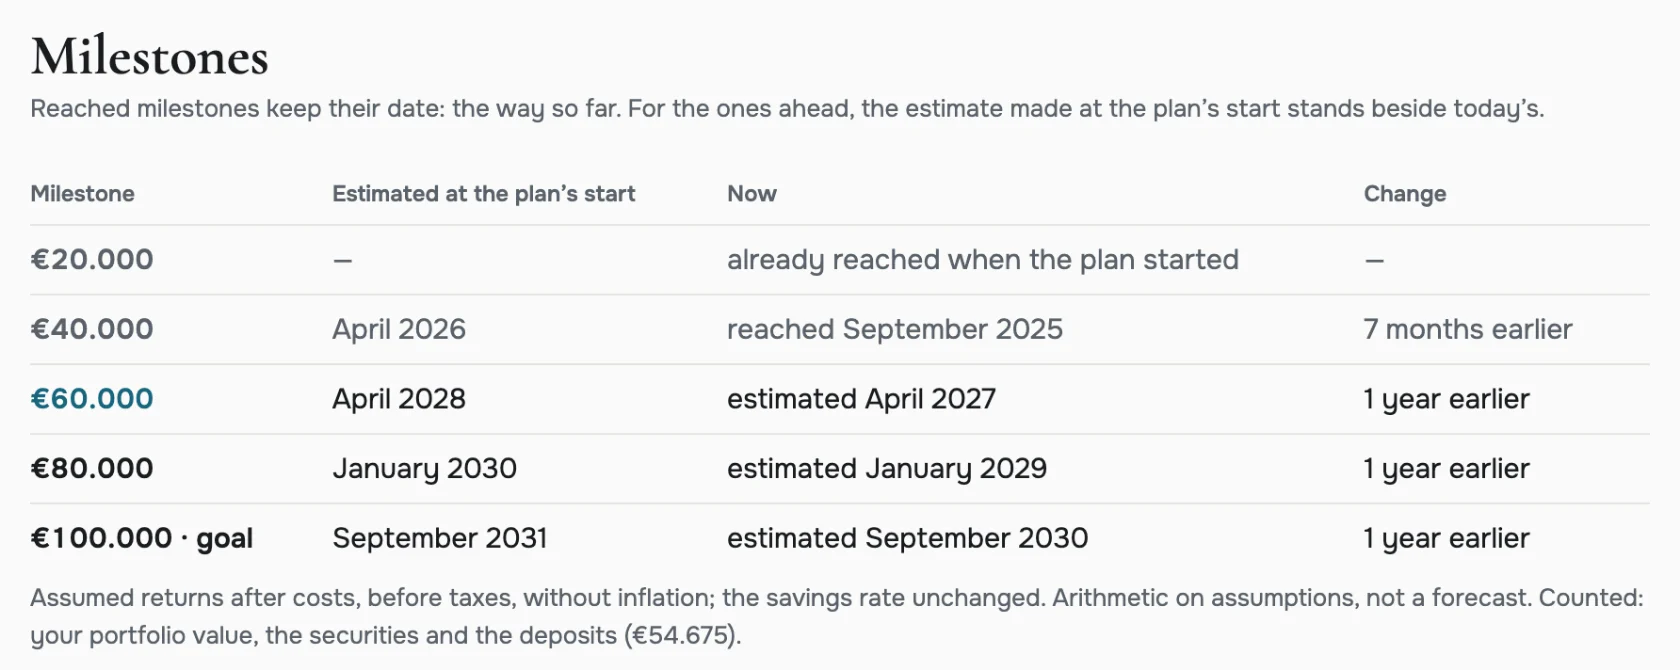
Open the full-size screenshot
The plan's start records what you started from: the month, the value, the savings rate and the return. It stays unchanged until you update the plan yourself. The current estimates, by contrast, keep adjusting to your portfolio.
FIRE: the target from your spending
Instead of an amount of your own, you can derive the target from your spending. FIRE stands for "Financial Independence, Retire Early". The FIRE amount is then the capital from which you could cover your yearly spending at an assumed withdrawal rate. foliologic. calculates in today's money, that is, with the return after inflation. The inflation rate is your own assumption too.
With the page's example values it works out like this: €30,000 of spending a year ÷ a 3.5% withdrawal rate = €857,143. Whether your savings rate stays the same or rises with inflation is your choice; the estimate takes it into account.
The withdrawal rate is an assumption, not a guarantee – no rate is safe in every case. The calculation leaves out taxes and other income, such as a pension. At first the FIRE amount is a preview. It becomes your goal only when you adopt it with "Use as goal" and save the plan.
The Long-term view
On your overview you choose between two views. "Research" stays the default. "Long-term" leads with the questions that matter when you invest for the long run: how your wealth is developing, where you stand on the way to your goal, and whether anything in your portfolio deserves a look.
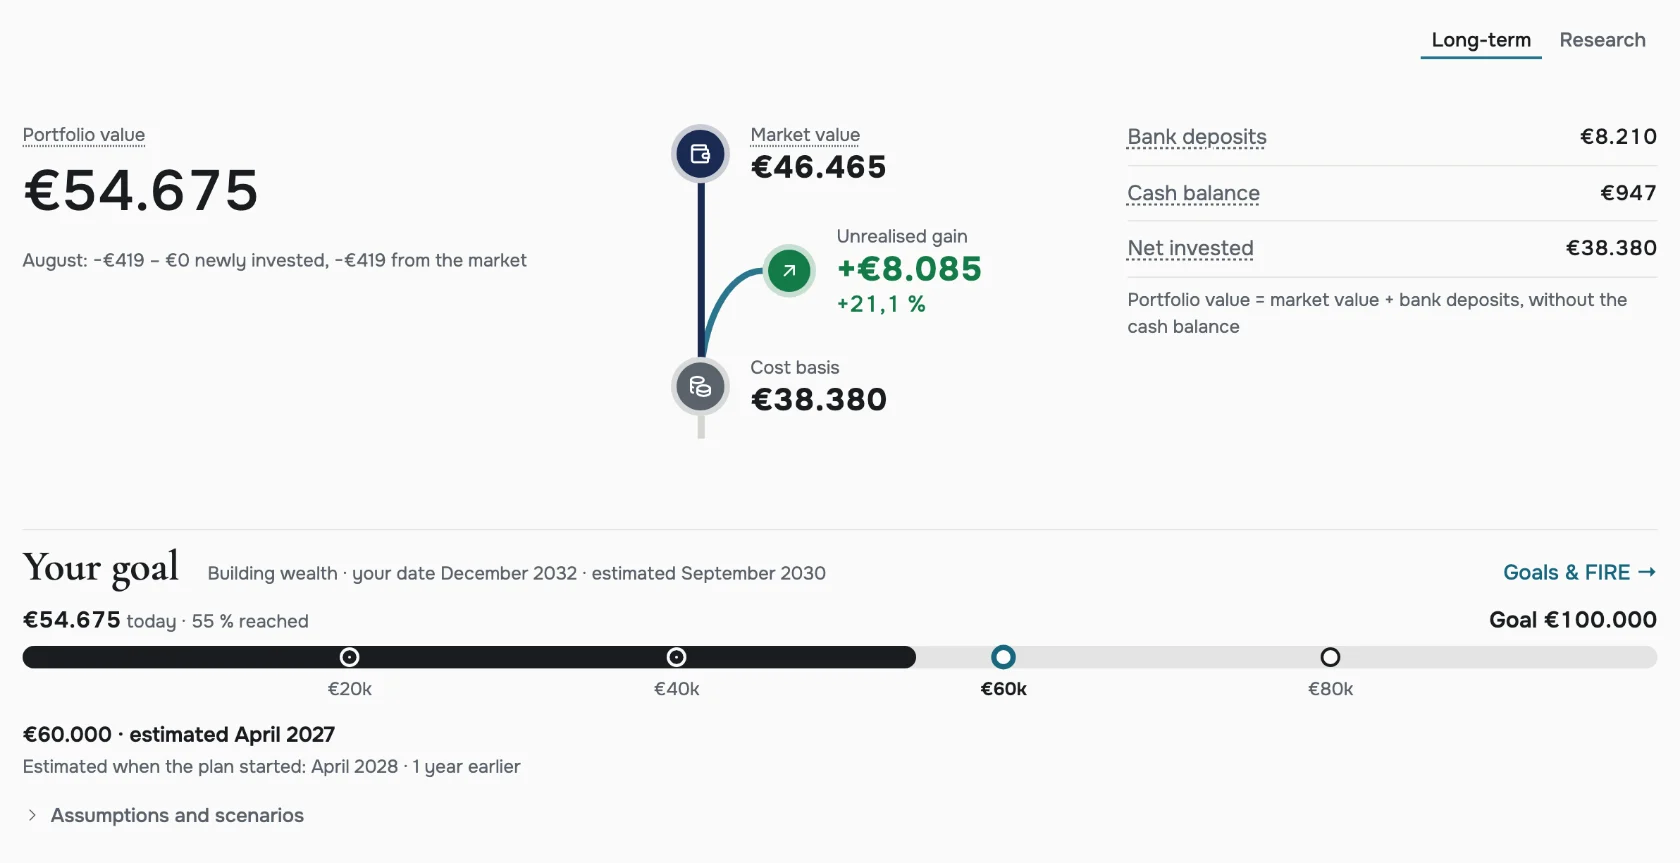
Open the full-size screenshot
- At the top is your portfolio value. Below it you see how the market value of your holdings changed last month – through newly invested money and through what the market did.
- Your goal shows the bar from today's value to the target with its milestones, along with your date and today's estimate. Without a goal the bar stays empty until you set one.
- Your portfolio checkup names what deserves a look. On every plan it shows gaps in the data, such as positions without a cost basis or a price. With Core it also checks whether a company makes up 10% or more of your portfolio, directly and through your ETFs combined, and whether you deviate from your target allocation by 5 percentage points or more. It then also shows how much your two most similar ETFs overlap. foliologic. sets these thresholds; they are not a general rule and not a recommendation to buy or sell anything.
- Further down come the value chart, the allocation and what moved most recently. Your positions are one click away.
You can switch views at the top right of the overview in a wide window, and at the end of the overview in a narrow one, such as on a phone. Your choice is saved with your encrypted portfolio and applies on all your devices.
Which plan?
Goals & FIRE and the Long-term view are included in every plan, Free too. In your portfolio checkup, three checks need Core:
- concentration in single companies
- the deviation from your target allocation
- the overlap between your ETFs
On Free, a note about Core appears in their place. Core costs €6 a month including VAT if you pay monthly.
How to start
Open Goals & FIRE in the app – in the menu under "AT A GLANCE" – and choose "Set a goal". In the Long-term view, "Set a goal" under the empty bar takes you there too.
New to foliologic.? Free costs nothing, and you need no payment details: Start free.